
Efront releases latest quarterly private equity performance benchmarks
eFront, the leading financial software and solutions provider dedicated to private markets, and a part of BlackRock, has released its latest eFront Insight Quarterly Performance Benchmark report, covering the period to the end of Q2 2023.
The report shows that the global private markets are consistently on an upward trajectory in terms of performance, achieving their third consecutive quarter of positive growth. Notably, the VC market has finally exhibited signs of a rebound following five quarters of decline. After two years characterized by declining capital calls and distributions, the second quarter of 2023 signalled a reversal, with a modest uptick in distribution rates.
eFront Insight Research performance metrics are calculated using the cashflow information of 8,000 unique private market funds globally and are provided on a net-of-fee basis. Data for Q2 2023 indicates a quarterly growth of 1.3%, reflecting a marginal moderation in the pace of recovery and expansion within the private market sector (Figure 1).
Figure 1 – Evolution of Quarterly Returns of eFront Insight Research Index, by Fund Strategy
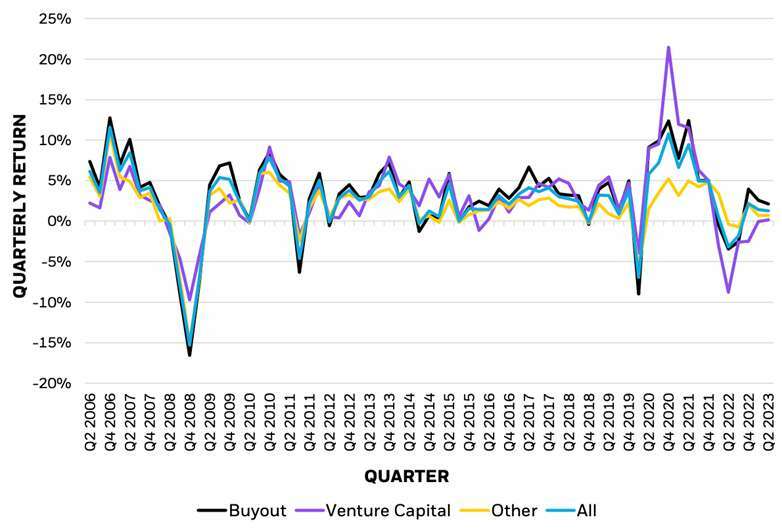
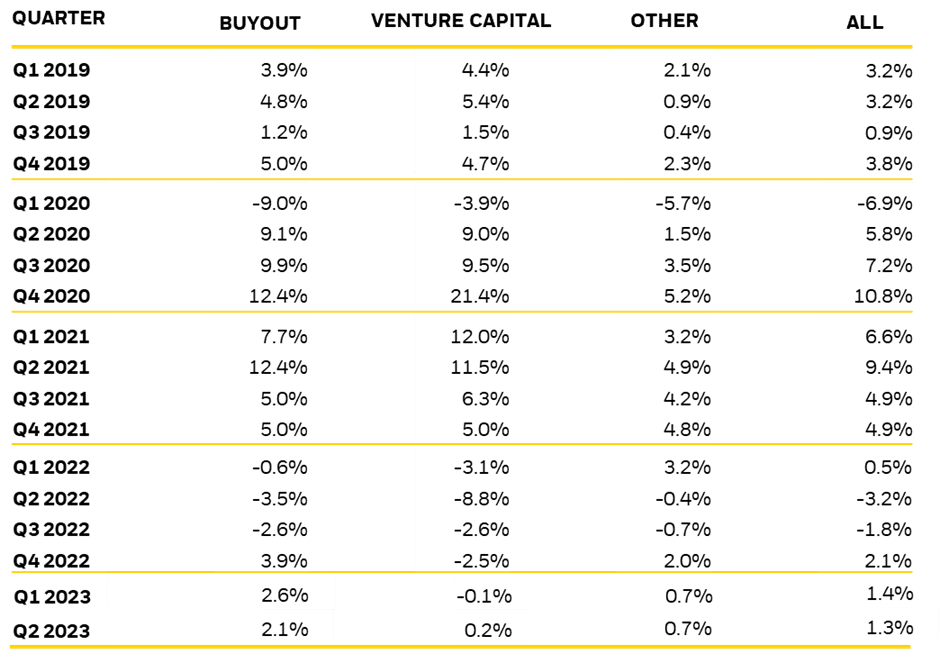
After enduring five consecutive quarters of negative performance, the VC market has finally shown signs of turnaround, achieving a modest positive growth rate of 0.2%. The global LBO market witnessed a significant resurgence in the last three quarters, with Q2 2023 producing a steady growth rate of 2.1% (Table 1).
Table 1 – Five-Year Quarterly Reports of eFront Insight Research Index, by Fund Strategy
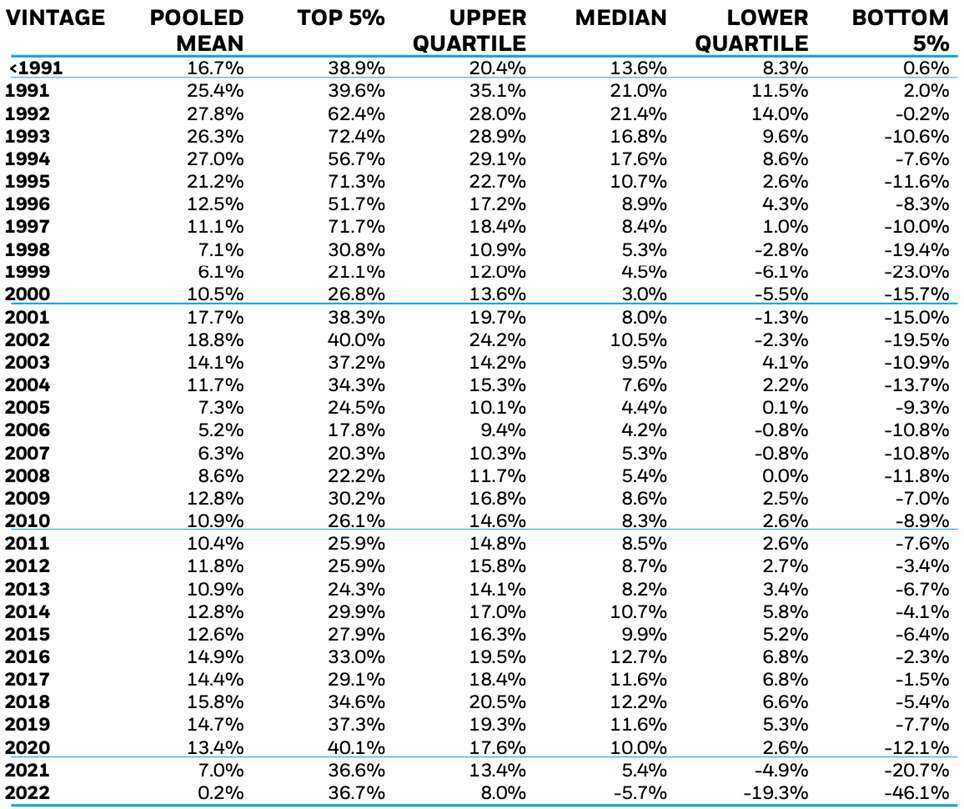
The private market’s positive growth in the period of Q4 2022 – Q2 2023 was coupled with a reduction in performance variation. The gap in investment-to-date IRR between the best and worst-performing quartile funds continued to narrow, decreasing from 14.9% to 13.6% during the second quarter of 2023 (Table 2).
Table 2 – Investment-to-Date IRR Quartile Returns, by Vintage Year
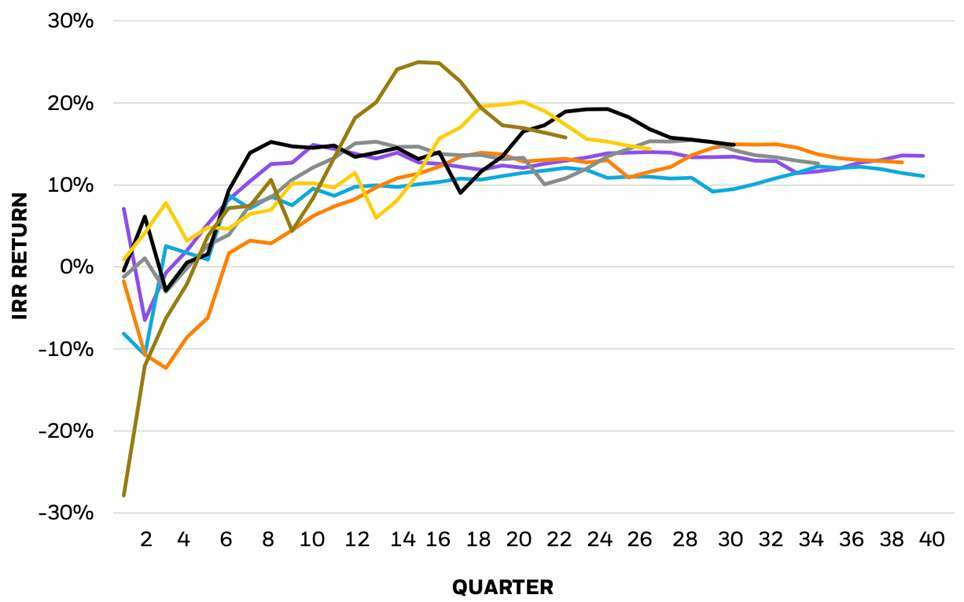
J-Curves illustrate the progression of fund performance over the active life of the fund. The steepest progression has been observed with vintage year 2018, while the most remarkable reversal in J-curves has been evident in the most recent vintage years over the past 5-6 quarters (see Figure 2).
Figure 2 – Time Adjusted Pooled Mean J-Curves, by Vintage Year
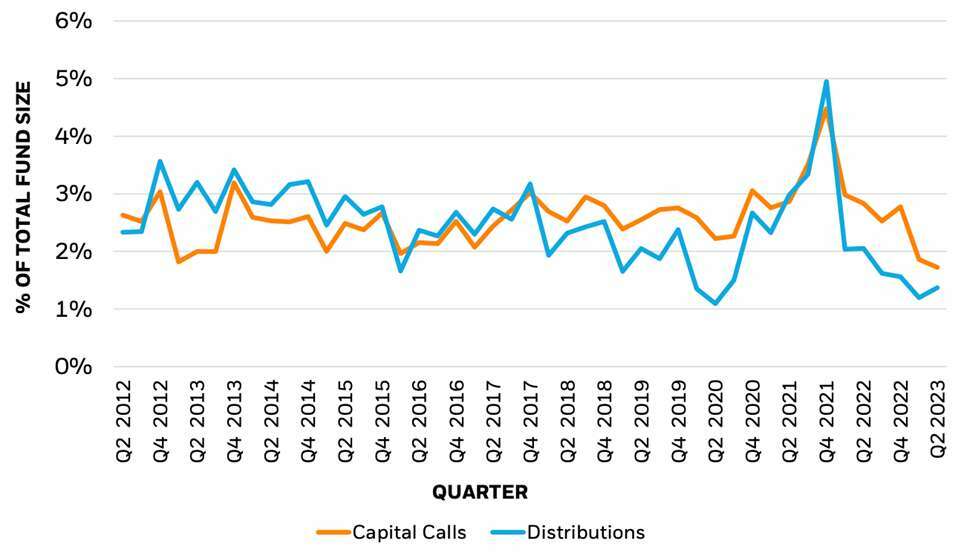
After the bullish phase in 2021, characterized by a surge in call volumes and distributions, quarterly distribution rates experienced a consistent decline over the past five quarters. However, the second quarter of 2023 marked a reversal with a moderate increase in distribution rates (Figure 3).
Figure 3 – Evolution of Capital Calls and Distributions
The eFront Insight database is directly sourced from investors. This ensures the accuracy needed to reliably benchmark alternative investments’ performance. The diversity in geographical locations, investment strategies, and vintages of our contributors’ exposures ensures that the eFront Insight database remains free from bias.